The Benefits of Dashboards for Data Analysts
Data analysts are responsible for taking large amounts of data and turning it into useful information. This can be a challenging task, but using dashboards can make the process much easier. Dashboards also provide a quick, at-a-glance view of important insights, which can help data analysts identify trends and patterns quickly.
In addition, dashboards can help analysts communicate their findings to others in a clear and concise way. It can improve their productivity and efficiency while delivering valuable insights to their organization. Read on to learn more!
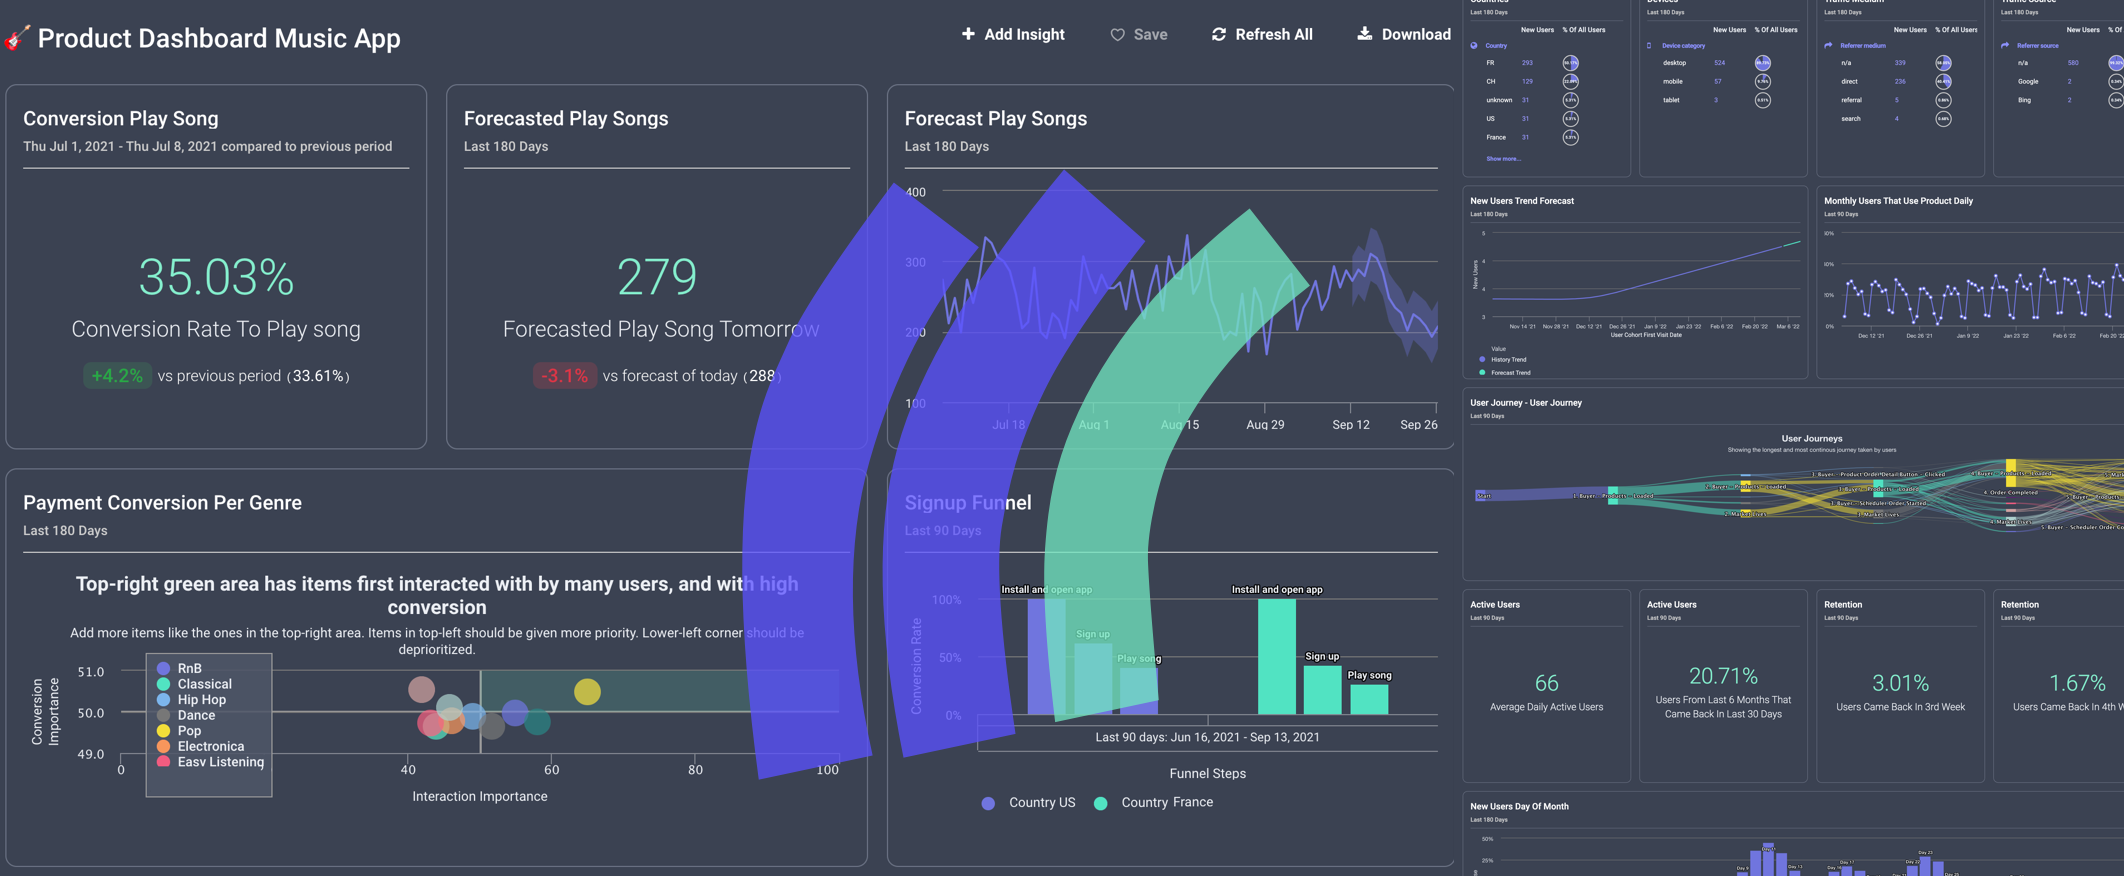
A dashboard is a visual representation of data that allows analysts to quickly identify patterns and trends. Benefits of using a dashboard include the ability to see relationships between different data sets, spot outliers, and track performance over time.
Dashboards can be customized to show only the information that is most relevant to the user, making them an efficient tool for data analysis. In addition, they can be shared with others, allowing for collaboration and dissemination of findings. By providing insights into data, dashboards can be used to make better decisions and improve business outcomes.
Data analysts are always looking for ways to quickly assess and act on important information. Dashboards can be a great tool for doing this. They provide a central location for analysts to view all of the data they need to make decisions.
Dashboards also allow analysts to easily filter and group data to find the most relevant information. And finally, dashboards provide a way for analysts to share their findings with others in a concise and professional manner. By using dashboards, data analysts can save time and energy while still making sure they have all the information they need to make informed decisions.
They are also a handy tool for monitoring various types of data. By displaying information in an easy-to-read format, dashboards can help users spot trends and identify areas that need attention. Dashboards can be used to track just about any type of data, but they are particularly well suited for monitoring financial data, sales data, website traffic, and social media metrics. When used effectively, they can help businesses make more informed decisions and optimize their performance. As the saying goes, “a picture is worth a thousand words.” With dashboards, businesses can gain valuable insights simply by taking a glance at their data.
Creating a custom dashboard can be a great way to get the most out of your data. By tailoring the dashboard to your specific needs, you can ensure that you are always seeing the information that is most important to you.
There are a few things to keep in mind when creating a custom dashboard. First, decide what information you want to see. This may include KPIs, metrics, or other data points. Next, consider how you want to display the information. Do you want charts, graphs, or something else? Finally, think about how you will access the dashboard. Will it be on your desktop, mobile device, or somewhere else? By keeping these things in mind, you can create a custom dashboard that is tailored to your specific needs.
The easiest way to create custom dashboards is with Stormly. It’s an essential tool for data analysts. With just a few clicks, they can generate insights that would otherwise be difficult to obtain. The ability to share these insights with others makes it even easier to collaborate on projects.
And the ability to schedule emails that deliver the dashboards when new segments or predictions are found makes it easy to stay up-to-date on the latest information. As a result, Stormly’s dashboards are an invaluable tool for anyone who needs to access and analyze data.
In order to get the most value from dashboards, it is important to design them in a way that is clear and easy to understand. The layout should be intuitive, and the information should be presented in a way that is easy to digest.
In addition, it is important to choose the right metric for each dashboard. Too much information can be overwhelming, so it is important to focus on the most important metrics. It is also important not to forget about the human element of dashboards.
They should be designed with the user in mind, taking into account their needs and preferences. By following these best practices,dashboards can be an invaluable tool for businesses of all sizes.
If you want to start taking advantage of the dashboard in your product analysis, create your first Dashboard with Stormly. In minutes, you will have access to actionable insights about your product! Give it a try and sign up today.
