Insight layouts are built using JSX components.
The minimum requirements is that the JSX opens with a <Insight> tag and closes with one. A title in <Insight> is optional, and will be shown in the upper left corner as a small title.
Insights are built using the following four components mainly:
<Title> — Header for a section:
<Title>30-Day Forecast</Title>
<Subtitle> — Sub-header that usually comes right below the <Title>:
<Title>30-Day Forecast</Title>
<Subtitle>What you can expect in the next 30-days</Subtitle>
<Txt> — Display a paragraph of text:
<Txt>Some paragraph here</Txt>
<Chart> — Displays a chart. More info later in the Chart api-library docs.
<Chartdata={data.forecast}/>
The next section shows examples of the most common layouts.
A one column layout is simply made by adding content within the <Insight> component.
<Insighttitle="Forecast">
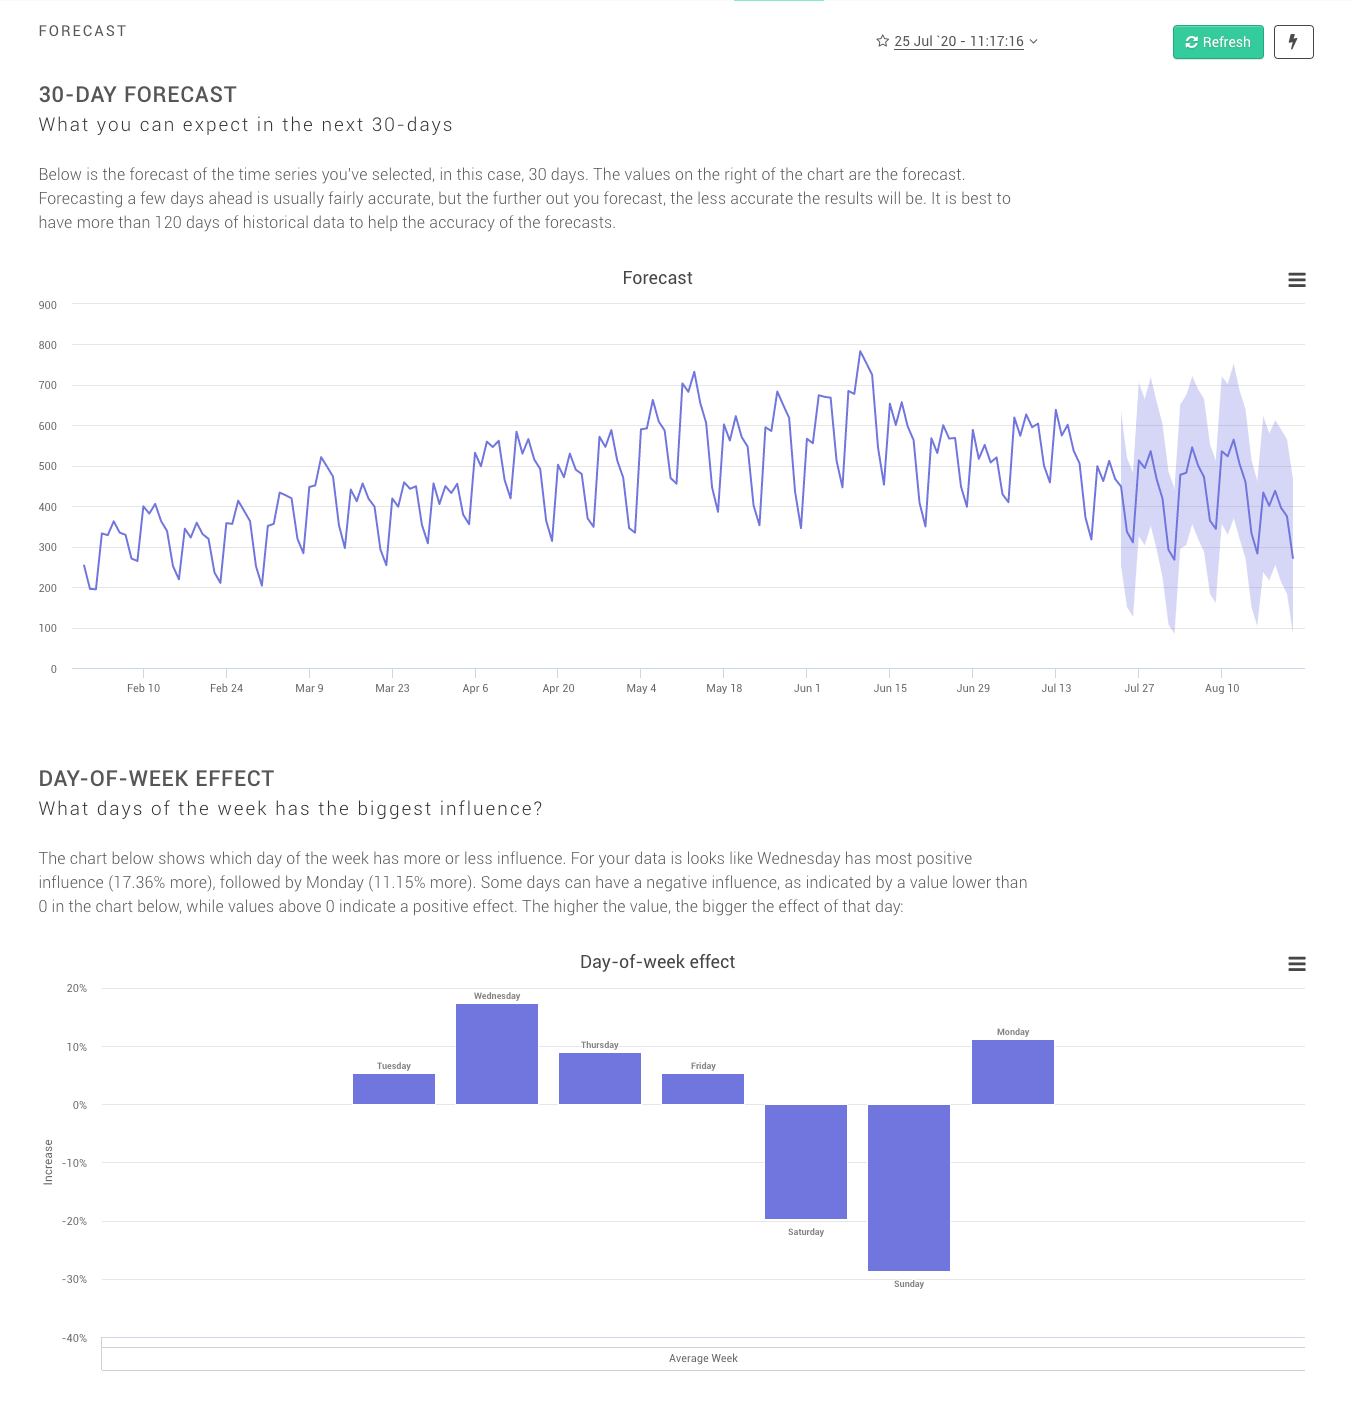
<Title>30-Day Forecast</Title>
<Subtitle>What you can expect in the next 30-days</Subtitle>
<Txt>
Below is the forecast of the time series you've selected,inthiscase,30 days. The values on the right of the chart are the forecast. Forecasting a few days ahead is usually fairly accurate, but the further out you forecast, the less accurate the results will be. It is best to have more than 120 days of historical data to help the accuracy of the forecasts.
<Subtitle>What days of the week has the biggest influence?</Subtitle>
<Txt>
The chart below shows which day of the week has more or less influence. For your data is looks like Wednesday has most positive influence(17.36% more), followed by Monday(11.15% more). Some days can have a negative influence,as indicated by a value lower than 0in the chart below,while values above 0 indicate a positive effect. The higher the value, the bigger the effect of that day:
A two column layout is made by adding a <TwoColumn> component, and directly under that add two <Column> children. Within each of the <Column> you can add content as usual, like in the example below:
<Insighttitle="Forecast">
<TwoColumns>
<Column>
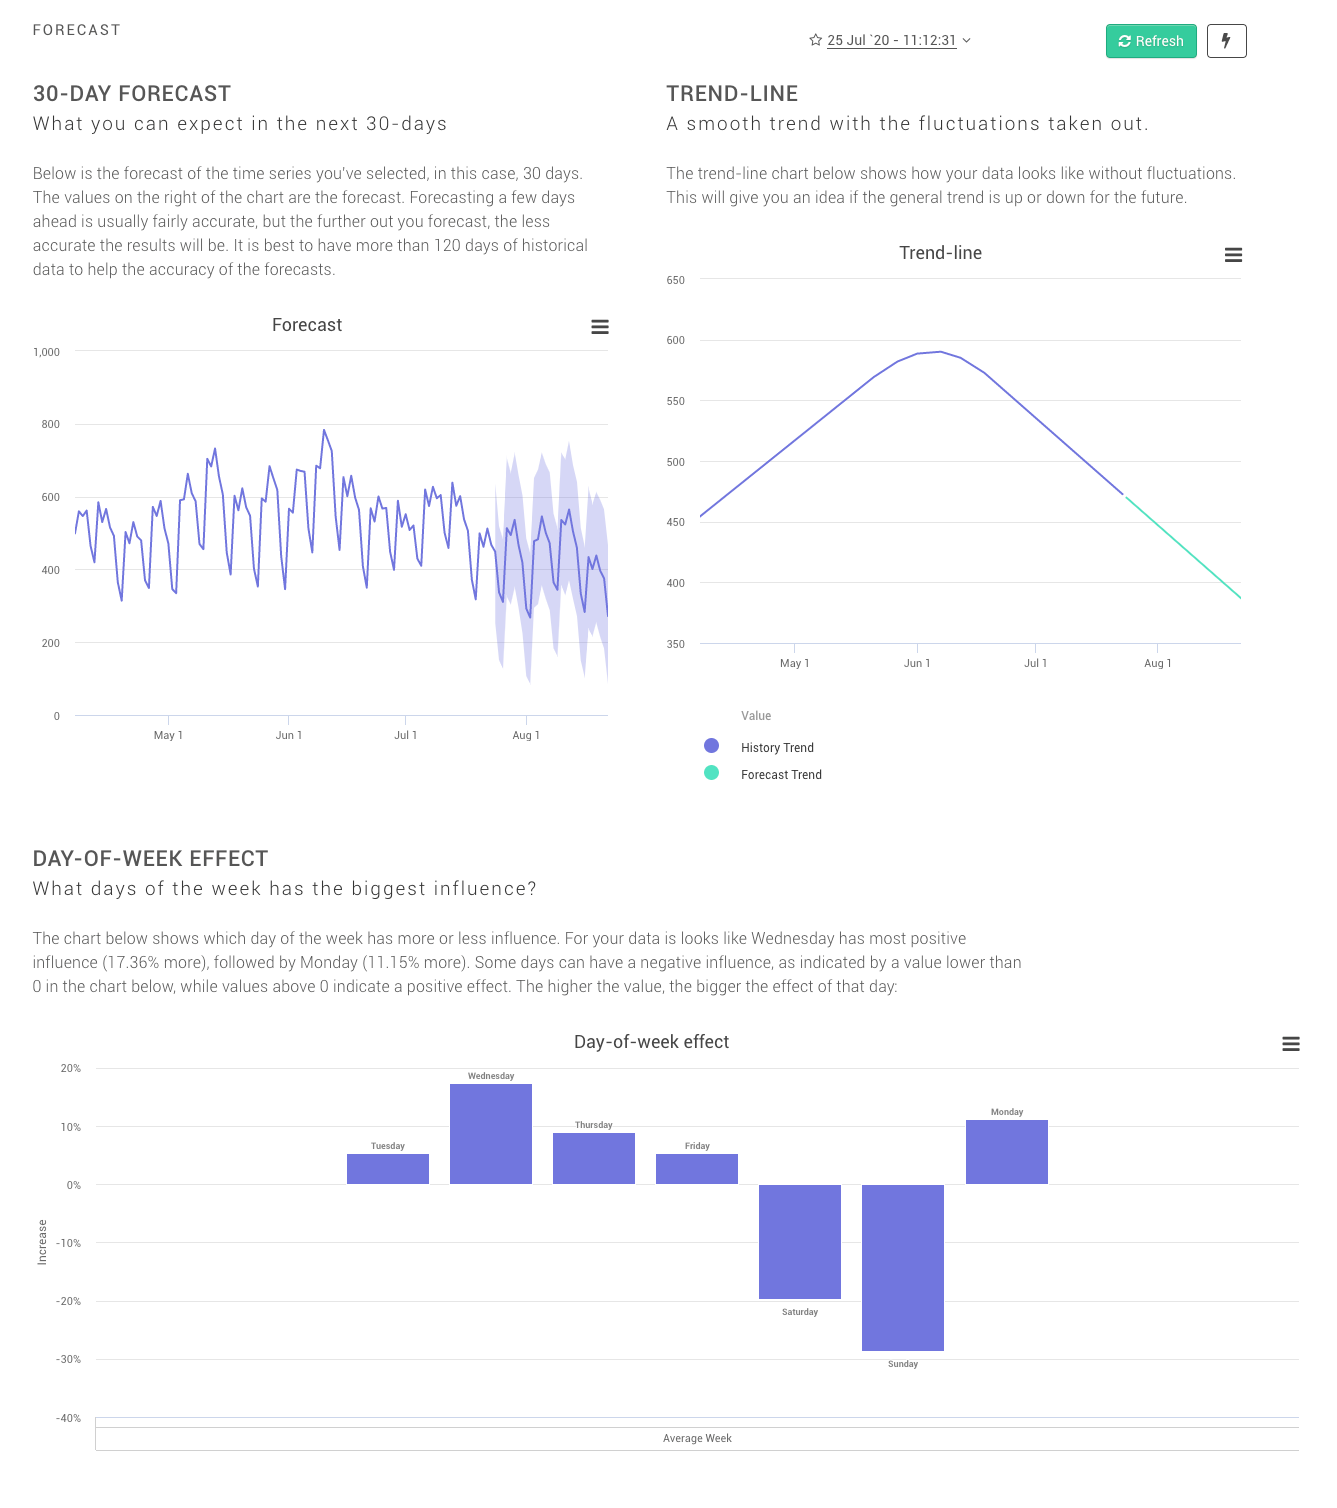
<Title>30-Day Forecast</Title>
<Subtitle>What you can expect in the next 30-days</Subtitle>
<Txt>
Below is the forecast of the time series you've selected,inthiscase,30 days. The values on the right of the chart are the forecast. Forecasting a few days ahead is usually fairly accurate, but the further out you forecast, the less accurate the results will be. It is best to have more than 120 days of historical data to help the accuracy of the forecasts.
<Subtitle>A smooth trend with the fluctuations taken out.</Subtitle>
<Txt>
The trend-line chart below shows how your data looks like without fluctuations. This will give you an idea if the general trend is up or down for the future.
<Subtitle>What days of the week has the biggest influence?</Subtitle>
<Txt>The chart below shows which day of the week has more or less influence. For your data is looks like Wednesday has most positive influence(17.36% more), followed by Monday(11.15% more). Some days can have a negative influence,as indicated by a value lower than 0in the chart below,while values above 0 indicate a positive effect. The higher the value, the bigger the effect of that day:</Txt>
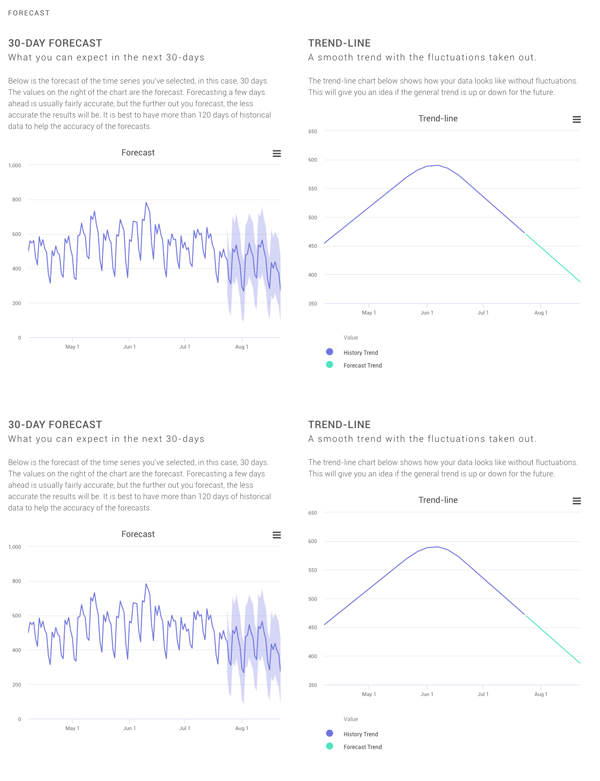
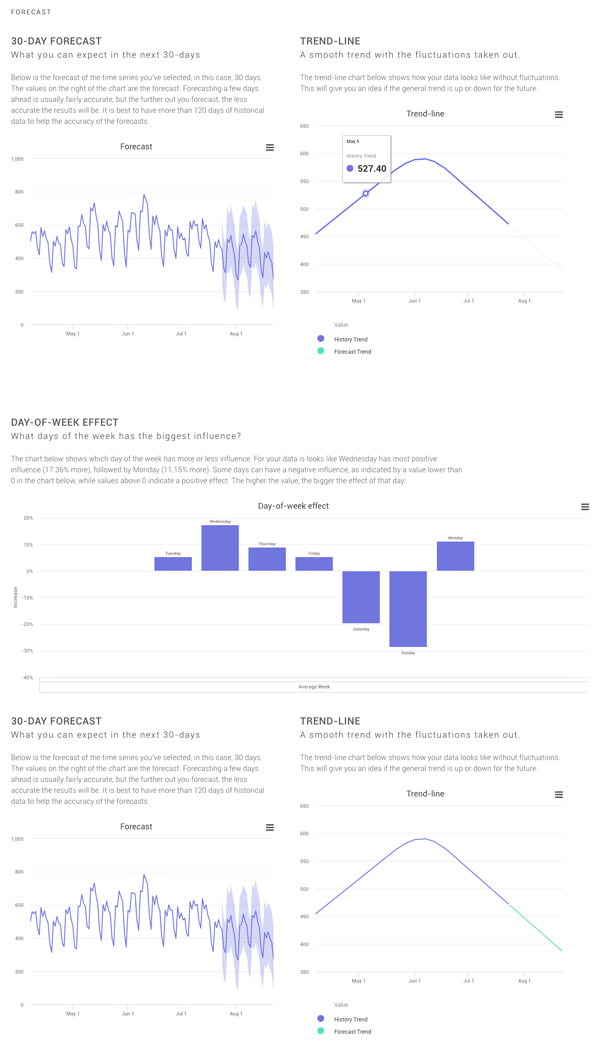
After the <TwoColumns> you can add still more content, so that your first section contains two columns and after that comes a one column section, like above.
Two columns and one column can be combined in multiple ways. You could for example add two <TwoColumns> components directly after each other, so that your page will have two sections, each having two columns. This would roughly be structured in JSX as:
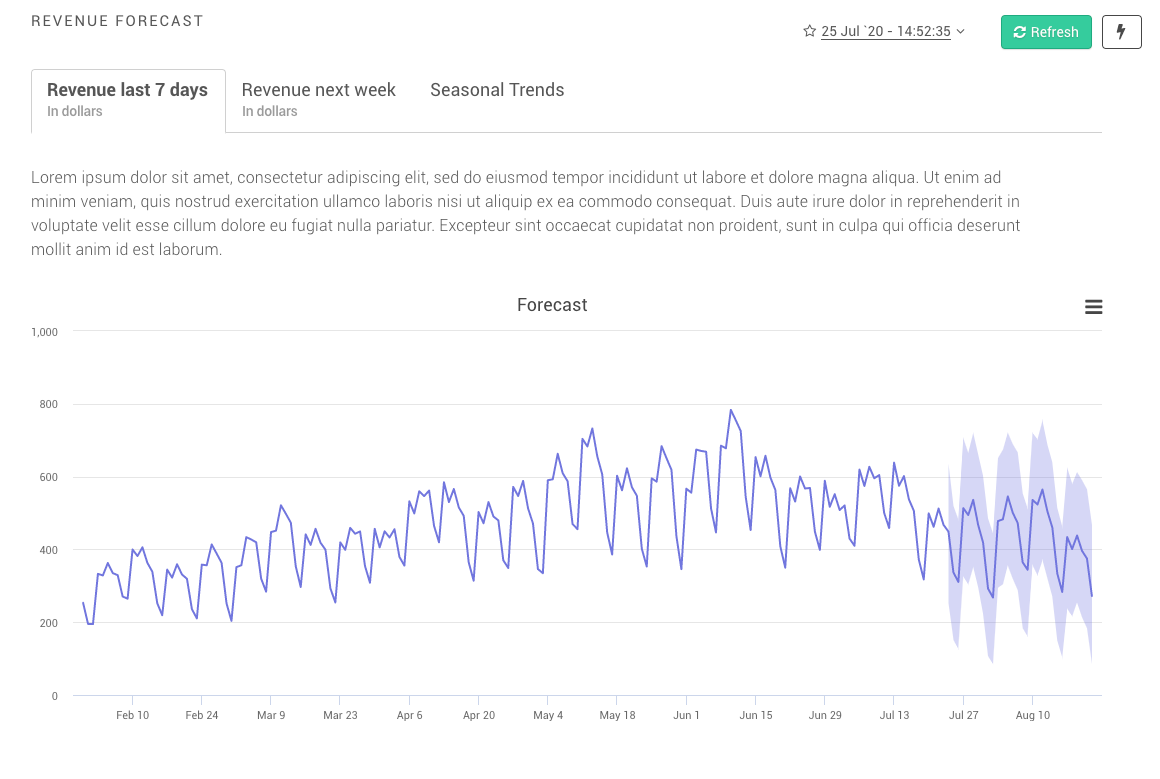
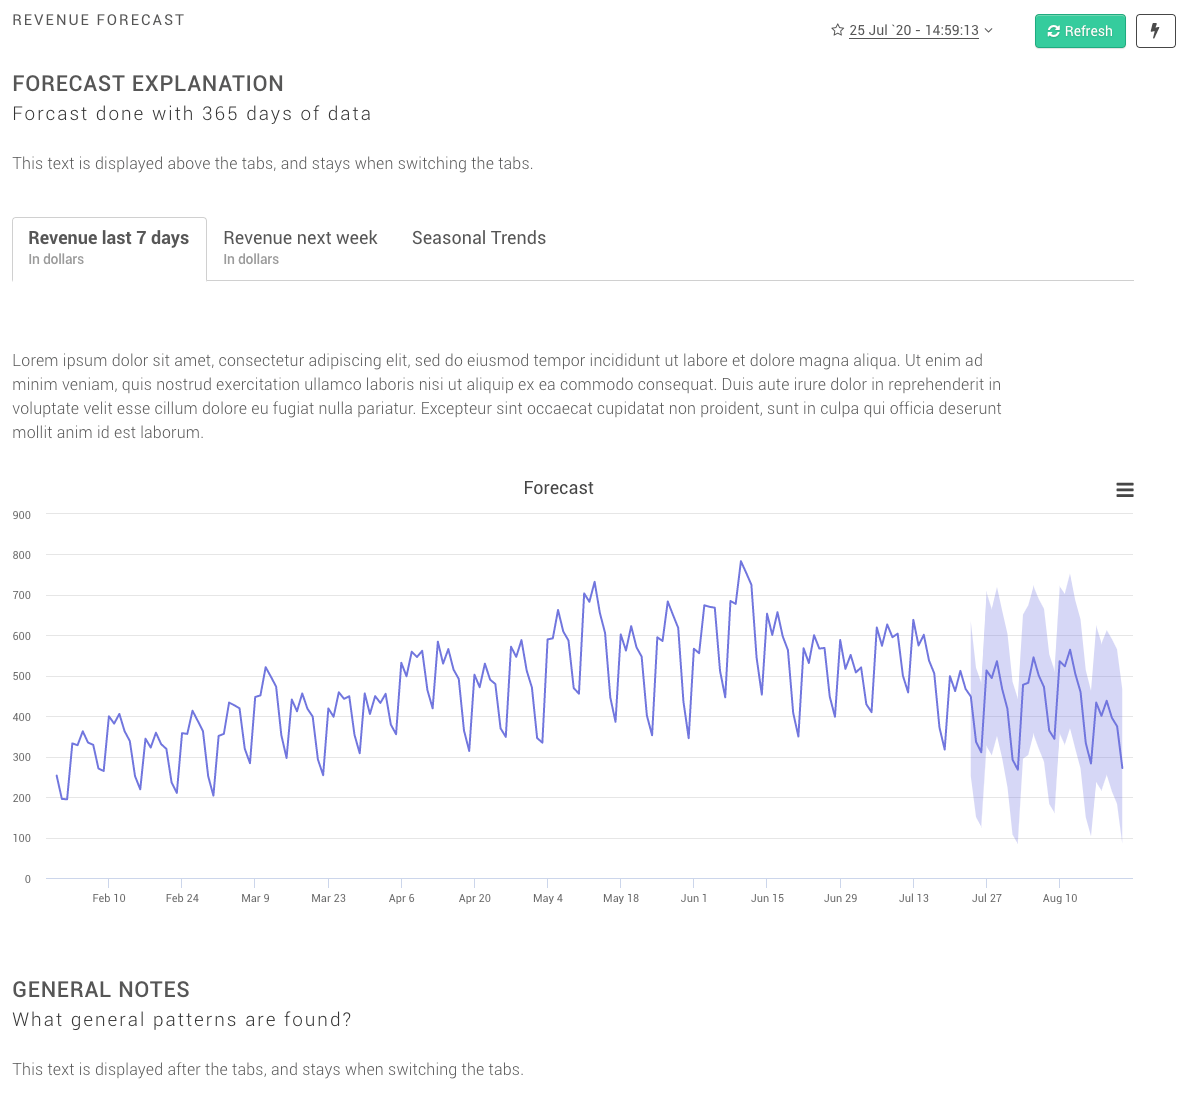
Tabs can be used to either navigate the full content of the Insight, meaning that after the <Tabs> there are no other components, or only a part of the Insight in which case more components follow after <Tabs>.
Within each tab, you can add any number of <Tab> elements. Under each Tab you can add any component, including <TwoColumns>.
Tabs cannot be nested, but you can have multiple <Tabs> on the same page.
Each Tab needs a title, but subtitle is optional.
<Insighttitle='Revenue Forecast'>
<Tabs>
<Tabtitle='Revenue last 7 days'subtitle='In dollars'>
Use <List> to create a list with one or more <Item>item 1</Item> to create a list of items. The numbered property on <List> defaults to false and can be set to true for a list ordered with numbers.
<Insight>
<Title>Forecasts</Title>
<Subtitle>With some highlights</Subtitle>
<Listnumbered={false}>
<Item>Revenue next week will be <Highlight>3.4% higher</Highlight>.</Item>
<Item>Conversion next week will be <Highlight>1.2% higher</Highlight>.</Item>
<Item>Next month will see <Highlight>15% more</Highlight> visitors</Item>