Why Product Managers need data visualization
In order to make effective product decisions, product managers need data. But simply having data is not enough. Product managers also need to be able to visualize that data in order to understand it and see trends. Data visualization tools can help them do this, and they are an essential part of any product manager’s toolkit. In this blog post, we will explore why data visualization is so important for product managers and discuss some of the best tools available.
As a product manager, you need to be able to quickly understand and make decisions based on data. Data visualization tools can help you do this by allowing you to see data in a more graphical form. This can help you identify trends and patterns that would be difficult to see otherwise. In addition, data visualization can also help you communicate your findings to others in a clear and concise way. So, if you want to be able to effectively manage your products, then you need to learn how to use data visualization tools.
When it comes to understanding data, a picture is worth a thousand words. Data visualization is a powerful tool for revealing trends, discovering relationships, and communicating complex information in an accessible format. By using charts, graphs, and other visual representations, data visualization makes it possible to quickly grasp the meaning of large data sets. And because the human brain is hardwired for pattern recognition, data visualizations can often reveal insights that would be difficult to spot in raw data. For these reasons, data visualization has become an essential tool in fields as diverse as business, medicine, and academia. Whether you are analyzing sales figures or tracking the spread of a pandemic, data visualization can help you see the big picture.
In today’s business world, data is everything. Companies rely on data to make decisions about everything from product development to marketing strategy. As a result, product managers need to be able to understand and use data visualizations. Data visualizations are graphical representations of data that can help to identify trends and patterns. They can be used to track customer behavior, understand how products are being used, and measure the effectiveness of marketing campaigns. Product managers who are able to effectively use data visualizations will be better equipped to make decisions that drive business success.
When it comes to data visualization, the sky’s the limit in terms of what types of information can be conveyed. However, data visualization is not just about generating pretty pictures, it’s also about unleashing the power of data storytelling. By representing data in a graphical format, stakeholders can quickly and easily see the relationships between different variables. This can be especially useful when trying to convey complex concepts or plan for future growth. In addition, data visualization can help to identify trends and patterns that would be otherwise difficult to spot. As a result, it can be an invaluable tool for making informed decisions about where to allocate resources. Whether you’re trying to sell a new product or gain support for a new initiative, data visualization can help you get your message across.
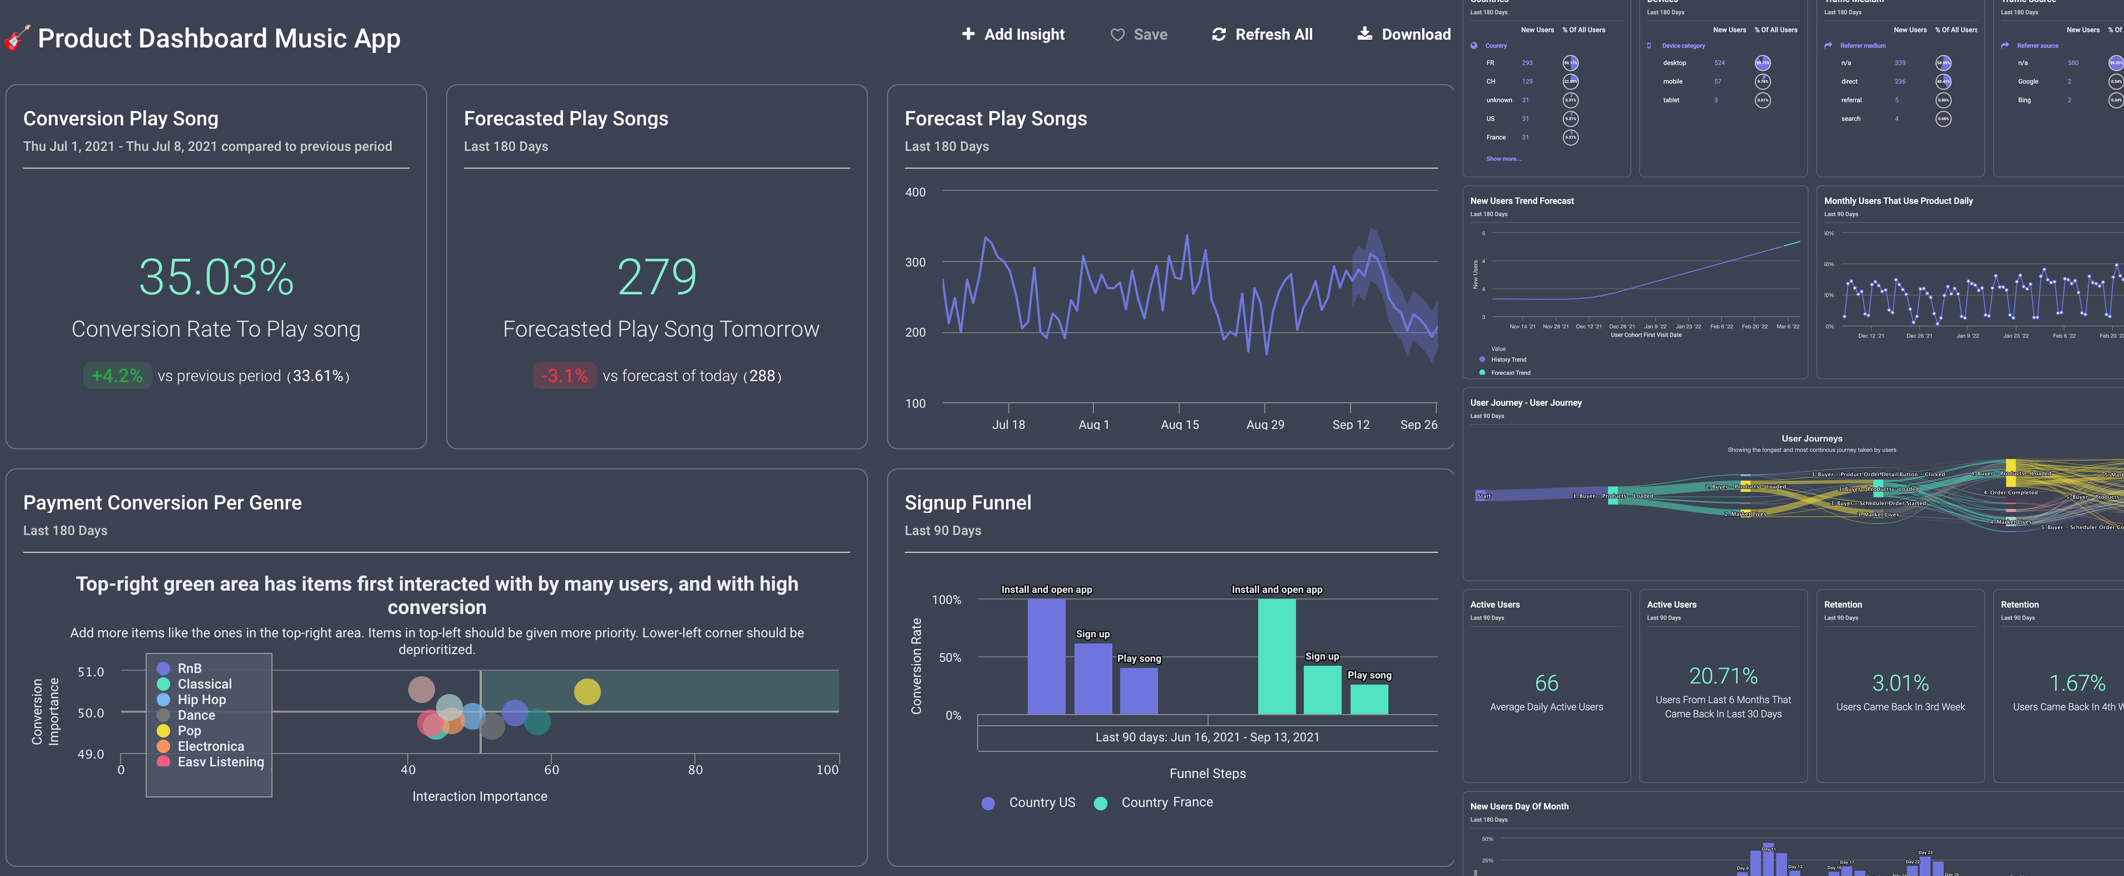
There are many different types of data visualization tools available, each with its own strengths and weaknesses. Some popular options include charts, graphs, maps, and infographics. When choosing a data visualization tool, it is important to consider the specific needs of your project. One popular option is Stormly, which not only visualizes data but also analyzes it and delivers ready-to-use, actionable insights. Stormly is particularly well-suited for visualizing large data sets, and its intuitive interface makes it easy to use even for complex data sets. Another advantage of Stormly is that it integrates with a variety of other software programs such as Segment or MParticle, making it easy to connect your data and start using it right away.
Data visualization is an important tool for product managers. By understanding how to use data visualizations, you can more easily see patterns and trends in your user data. This information can help you make better product decisions that improve your users’ experience. If you want to not only see your data on the beautiful charts and graphs,but also put insights from that data into action, sign up for Stormly. We will help you make informed product decisions.


