Milestone Analysis from Amplitude vs “Aha moment” Insight from Stormly
You have probably heard the term “Aha-moment” in different blogs and books related to product management and growth hacking. It is the moment where a user experiences the value of your product and becomes aware of its benefits. Like when you are using a website or app and you suddenly feel a pleasant moment of eureka because it is so useful.
It can also be the point when you “fall in love” with the product. You will most likely come back for more and eventually stay on as an engaged and loyal user.
It is this special metric that should be the focus of your behavior-based data analysis. Once you discover that sweet spot, you can start building your product and user experience around it and increase your chances of becoming the next popular app or website.
If you have seen the documentary “The social dilemma”, at some point, the former VP of Growth at Facebook says ”After analyzing all this data, after all this testing, we have come up to this: Get any individual to seven friends in ten days”. Just imagine Facebook, the leader in getting people to become more engaged with their app, finding their aha-moment and building everything else around it.
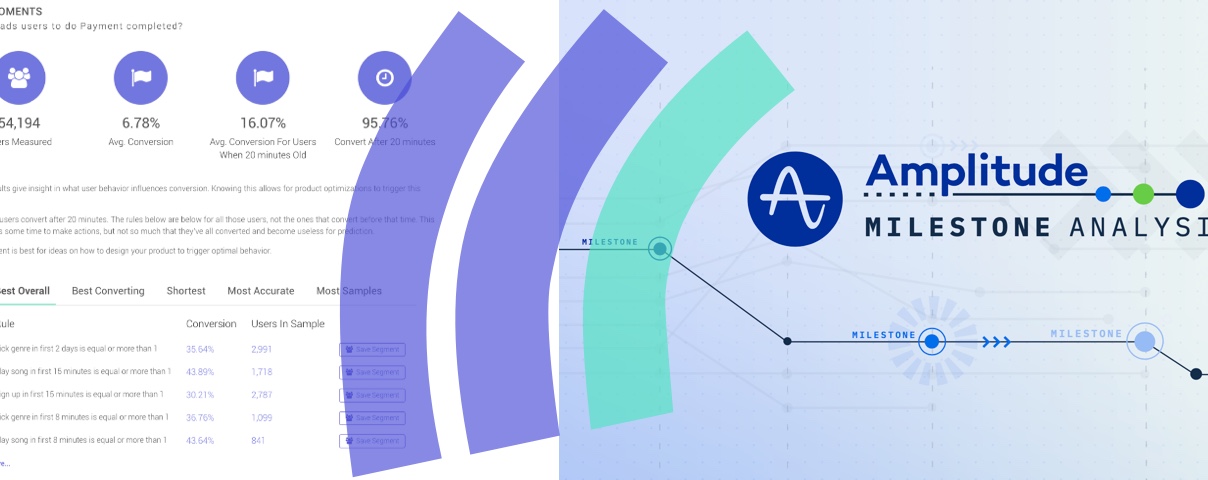
This is probably one of the reasons why Amplitude recently announced their new Milestone Analysis. For a music app the funnel may start with playing a song, then signup and finally paying for a premium subscription. Amplitude’s Milestone Analysis allows you to compare conversion to payment, but for funnels where users are playing a song the first time, playing a song the second time and playing a song the third time.
While doing this analysis can be useful in some cases, it’s nowhere close to uncovering your true aha-moment. To uncover that, you also need to:
- Limit the behavior to a specific timespan. For example playing 10 songs in the first two hours.
- Make sure you are working with unbiased data. Say you want to know how many songs played, in the first two hours, leads to payment. You should then only count the number of songs played before people converted to payment. If you don’t, you will overstate the number of play songs probably, because people who convert to a paid subscription are most likely to play a lot more songs.
- Make the whole process automatic and robust. With Amplitude you’ll have to do this analysis manually by hand, using trial and error. This can easily lead you to make mistakes and base conclusions on biased data. In short, you may end up making the wrong product decisions.
Stormly solves all of these problems with a simple and auto-pilot Aha-moment Insight. Making sure the insights are accurate, actionable and fully automatic. With just a few clicks it will give you a full overview of behavior that leads to for example retention or payment conversion. A few examples:
- Listening to 10 songs in the first 2 hours.
- 10 friends added in the first 7 days.
- Sending 15 messages in the first 3 days.
Discovering your aha-moment has been one our biggest priorities when it comes to possibilities that Stormly opens. The Aha-moment Template is not the only one that gives your more insight into user behavior. Many other Templates such as the Retention and Session. Templates do the same for their respective metrics.
With Stormly, it is possible to build ready-to-use Insights, but also use our Insights that allow you to run an extremely powerful analysis on your data within just a single click.
If you want to discover your product’s Aha- moment, simply Sign Up for our free 30-day trial, or schedule a Demo.

